GIS Day 2025
- Key Environmental Consulting

- Nov 19, 2025
- 2 min read
Updated: Nov 20, 2025
At Key Environmental Consulting, GIS is at the heart of how we help communities understand risk, plan resilient infrastructure, and make data-driven decisions. For GIS Day 2025, we’re highlighting a selection of recent spatial analyses that demonstrate how geospatial science supports environmental resilience.
Charlotte Corridors of Opportunity: Green Infrastructure Priority Mapping
In 2025 we conducted a spatial and statistical assessment of Charlotte’s six Corridors of Opportunity to identify where stormwater-focused green infrastructure (GI) can deliver the greatest co-benefits. Our analysis combined:
Serious-injury crash locations
311 flood-related service requests
Bus stop amenity conditions (sidewalks, shelters, benches)

Using R and ArcGIS Pro, we created a standardized GI Priority Index that highlights corridors with the highest overlap of crash risk, flood exposure, and limited pedestrian infrastructure.
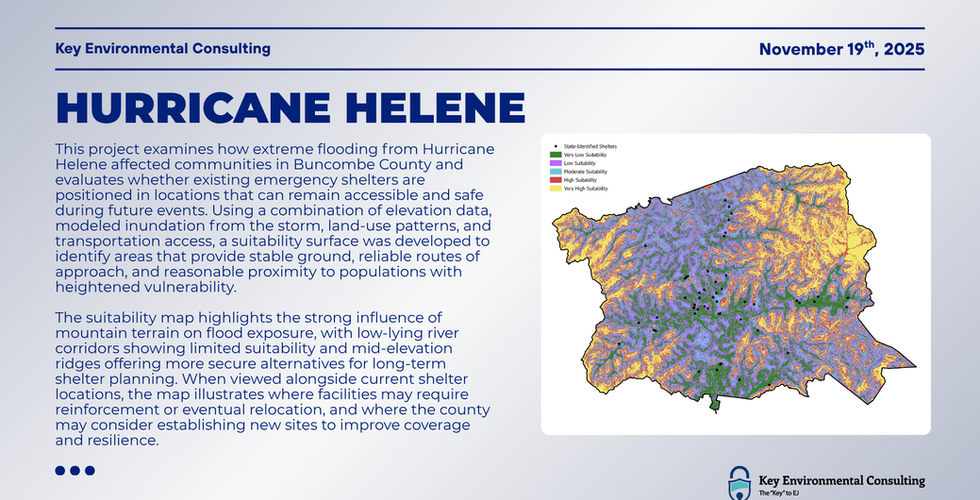
Hurricane Helene: Emergency Shelter Suitability in Buncombe County
Following the catastrophic flooding from Hurricane Helene, we developed a suitability surface to evaluate whether existing emergency shelters in Buncombe County remain accessible and safe during extreme events.
The model integrates:
High-resolution elevation
Storm-based flood extent
Land-use conditions
Road network accessibility
Proximity to vulnerable populations

The resulting map underscores how steep mountain terrain shapes flood exposure: low-lying river corridors show low suitability, while mid-elevation ridges provide more reliable ground for emergency shelters. When compared to current shelter locations, the analysis helps identify facilities that may need reinforcement or relocation, and areas where new shelter sites could improve countywide resilience.
Fire Density and Vegetation Decline in South America
This series of fire-density maps was developed as part of a long-term study investigating how vegetation loss (measured using NDVI) correlates with wildfire activity across South America.
Using NASA MODIS and VIIRS fire count data, we produced four kernel-density surfaces representing multi-year intervals. The maps illustrate:
Expanding fire-prone areas in and around the Amazon basin
Intensifying ignition clusters in the 2017–2022 period
Geographic shifts in fire concentration linked to deforestation and land-use change

This time-series approach helps visualize how ecological disturbance and human pressures connect to fire severity and spatial distribution.
Click below to learn more about our recent map products below:


Comments